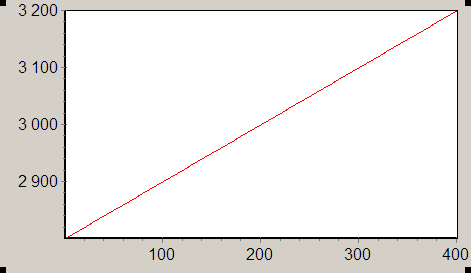
For example letтАЩs consider file 50fs.dat located in directory <Spectrum installation directory>\samples\. If weтАЩll plot this file by the function Add From File weтАЩll see rising straight line: It looks normal but it is not quite that graph as containing in the file.
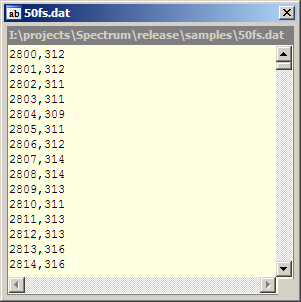
Looking into this file with help of any text editor or with help of the command Open in Buit-in Viewer we can see such text: Spectrum decided that the file is one column file having comma as decimal
separator and it made a graph in respective manner. But really each line of the
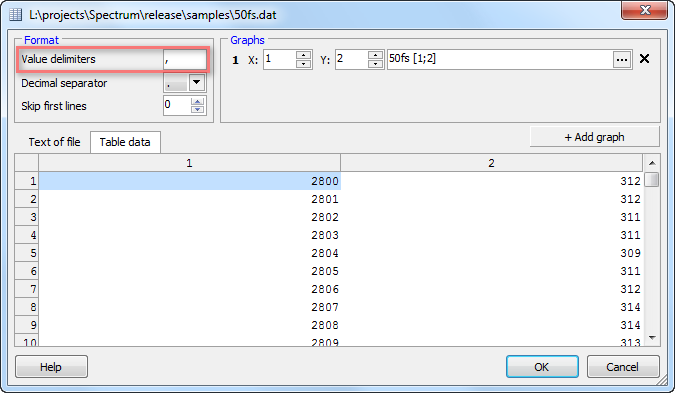
file contains two integer values delimited with comma. Then let’s delete wrong graph and try to plot the same file with help of the
command Add From Table. In parameters dialog of the function we explicitly
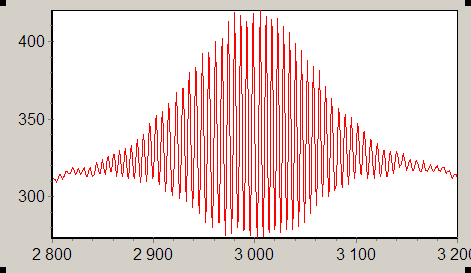
specify that comma is values delimiter: The graph we obtain by this method represents real data containing in the file: Note: You can tune Spectrum so that it will be able to quickly
open such a files by the function Add From File. To do that you have to
include comma into the global parameter “Value delimiters”. But then
you’ll lose an ability to open a file having comma as decimal separator. | 
)
)
)